How a data-driven retention, conversion, and funnel strategy doubled an Indian eCommerce brand's revenue and nearly tripled their order volume.
GROSS SALES
TOTAL ORDERS
RETURNING CUSTOMERS
NET SALES
01 · Client Overview
This case study is about a growing Indian D2C eCommerce brand selling across multiple categories. The store was already running. Orders were coming in. But after a point, growth stopped moving.
Gross sales were at ₹29.25L. The return customer rate was just 9.79%. In fact, the brand was depending too much on new customers. And that gets expensive over time. So the situation was simple: the business needed a BIG change in their system. And we did the same.
02 · Problem Statement
On the surface, sales were coming in, but growth was not happening. The business was stuck in a typical eCommerce problem (high returns, low repeat purchases, and gaps in order fulfilment). The sales graph stayed flat, with no strong upward movement.
Only 9.79% of customers returned to buy again. Most revenue depended on new customers.
Returns of ₹8.87L reduced overall sales, showing a gap between product and customer expectation.
Out of 809 orders, only 651 were fulfilled. A 19.5% drop in the conversion funnel.
Sales showed low movement over time, with no consistent growth.
| Metric | Before | After | Growth |
|---|---|---|---|
| Gross Sales | ₹29,25,125 | ₹56,15,940 | ↑ 92% |
| Returning Customer Rate | 9.79% | 14.5% | ↑ 48% |
| Total Orders | 809 | 1,897 | ↑ 134% |
| Orders Fulfilled | 651 | 1,236 | ↑ 90% |
| Net Sales | ₹20,38,076 | ₹40,79,019 | ↑ 100% |
| Discounts | ₹0 | ₹32,739 | Strategic |
| Returns | ₹8,87,050 | ₹15,04,181 | Volume-led |
Note: Return volume increased with the 134% order surge. Return rate as a percentage of gross sales remained stable, so there was no drop in product quality.
If your eCommerce brand has stopped growing, we can find the exact gaps and rebuild growth with a compounding strategy built around your business.
Book Your Free Growth Audit →No commitment. 30-minute deep conversation. Real insights, guaranteed.
04 · Strategy Breakdown

Checked the full journey from landing page to checkout. Removed friction points, improved product page trust signals, added social proof and urgency, and simplified mobile checkout so fewer users dropped off.

Set up post-purchase email flows, WhatsApp re-engagement, and loyalty nudges. Timed messages on Day 3, Day 14, and Day 30 helped bring customers back before they stopped engaging.

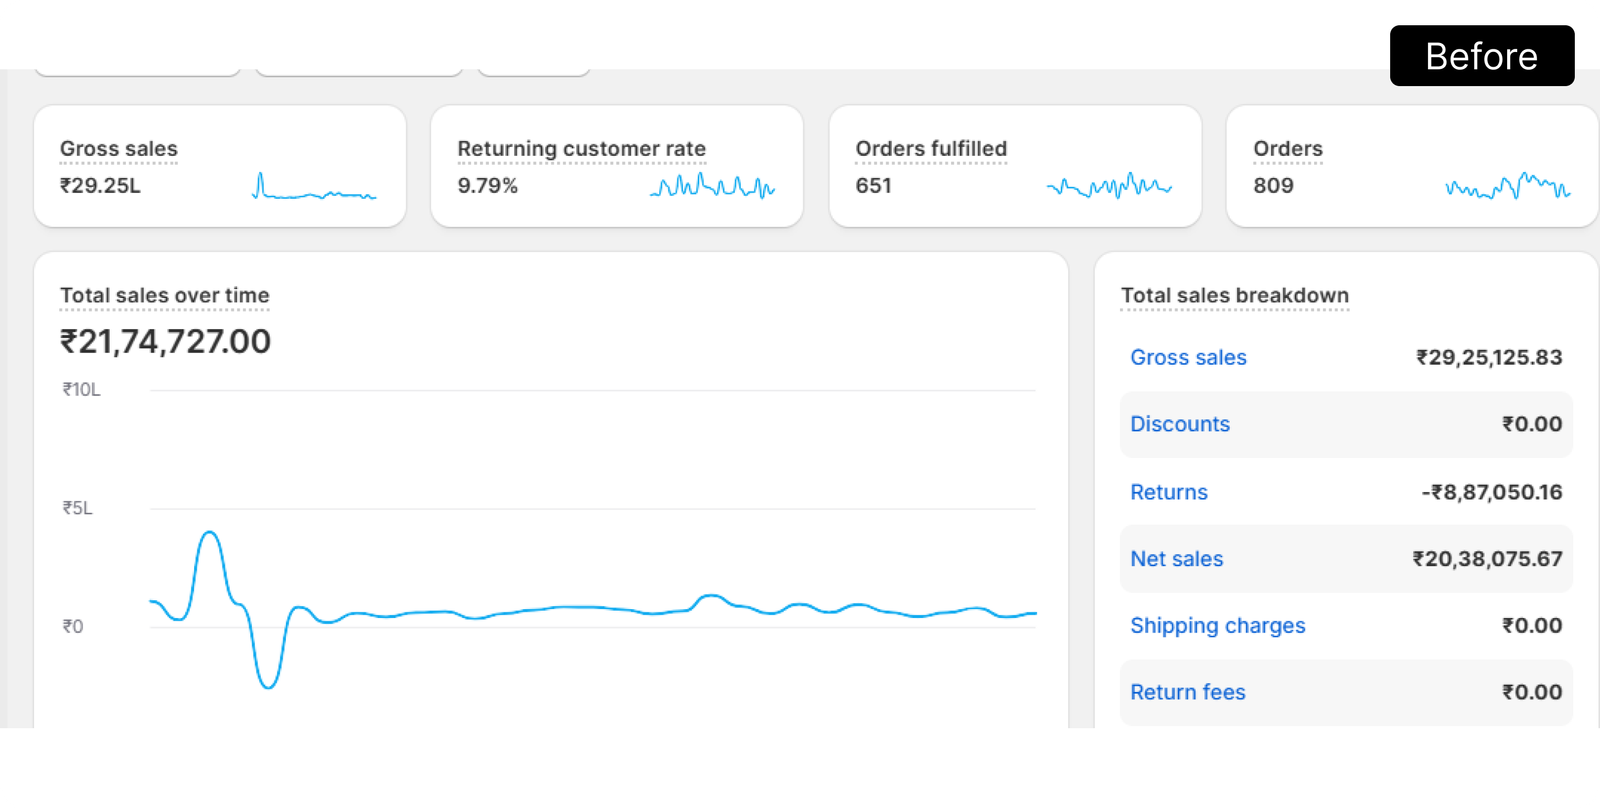
Reworked top-of-funnel targeting so better traffic started coming in. Fixed the drop between add to cart and purchase. Also improved post-fulfilment experience, so refund requests and returns started reducing from the source.

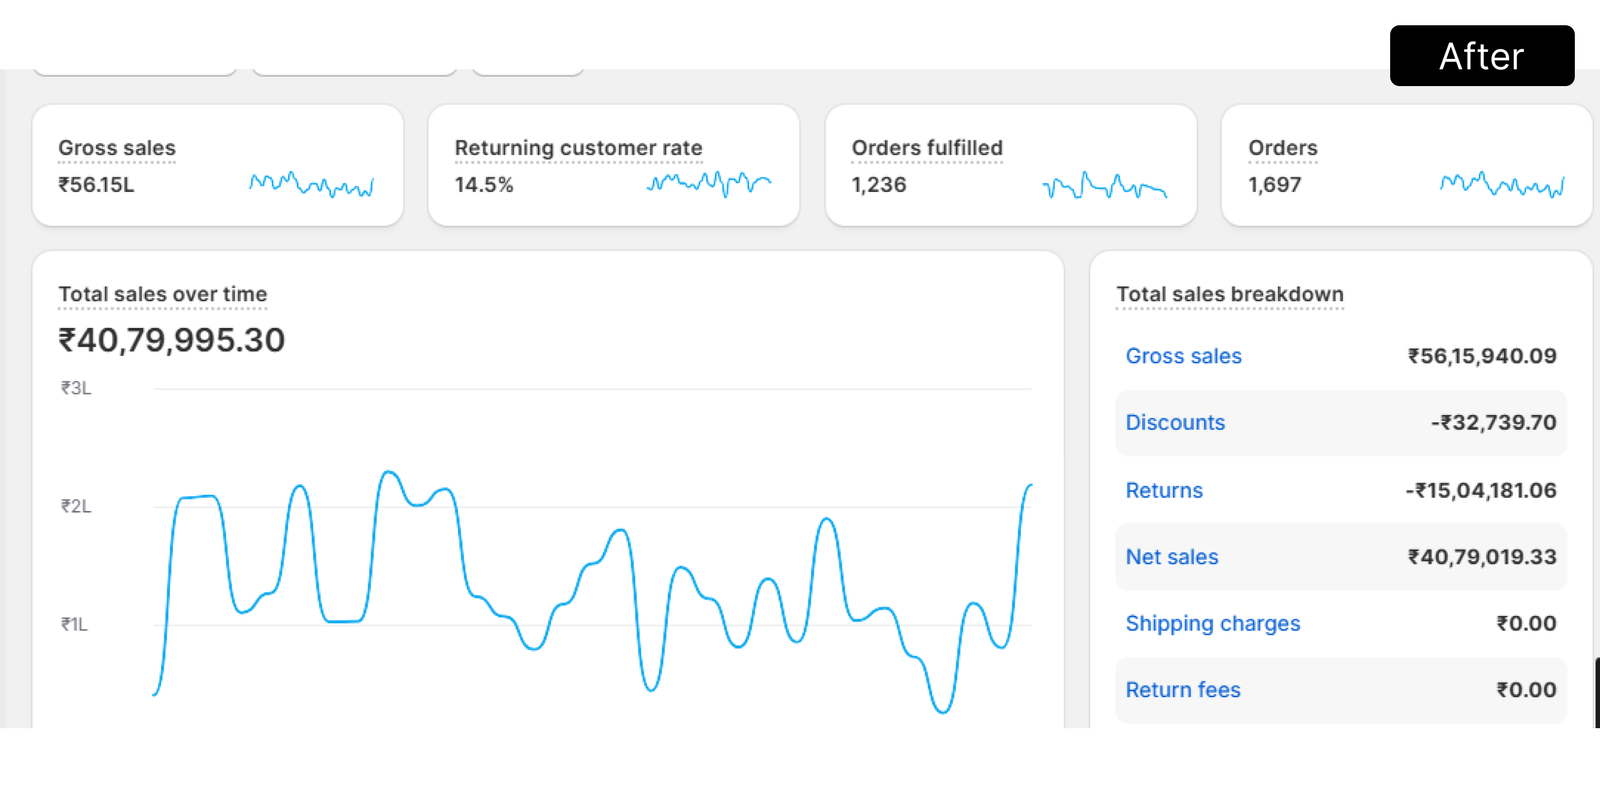
Introduced strategic discounting of ₹32,739 in targeted offers to push AOV and bring back inactive customers. At the same time, margins were protected. Bundles and upsell prompts were added at the cart and post-checkout to lift order value.
Went through historical orders, heatmaps, session recordings, and customer behaviour. And figured out the weak spots and revenue-dropping leaks.
Rewrote product descriptions, added UGC/review sections, included trust badges, and simplified for mobile; steps were reduced from 5 to 3.
Set up 6 automated post-purchase flows through email and WhatsApp. Like: thank-you messages, review requests, cross-sell nudges, replenishment reminders, win-back flows, and a VIP unlock after 3 orders.
Restructured Meta and Google campaigns. The budget was moved toward high-LTV customer segments. Lookalike audiences were created using the top 20% repeat customers.
Introduced targeted, time-limited offers instead of blanket discounts. Focused on inactive customers and AOV growth. Total ₹32,739 used in strategic discounting.
Worked closely with the ops team to improve fulfilment. Focus areas included stock management, courier SLA tracking, and reducing RTO using address verification tools.
06 · Data Insights from Dashboard
The line was almost flat, with very little movement. No peaks at all. That means no campaigns, no promotions, nothing pushing growth. Revenue was coming, but only from basic organic flow.
Now this is where it changes. The graph starts moving. You see clear ups and downs. Peaks coming after campaigns, then settling, then rising again. This is how a growing store behaves.
Earlier, only 9.79% of customers were coming back. Now it has moved to 14.5%. So roughly, 1 in 7 customers return, instead of 1 in 10. That reduces dependency on new customers and improves overall LTV.
Return value went up from ₹8.87L to ₹15.04L. But this increase came with higher sales volume. So as a percentage, it remained stable. Which means product quality and customer expectations were handled properly even at scale.
Earlier, there was no discounting. Now ₹32,739 was used in a controlled way. Targeted offers helped bring back inactive users and increased AOV.
07 · Results
Net Sales Achieved — Up from ₹20.38L
08 · Business Impact
Revenue scaled without doubling ad spend or team size
Higher retention reduced cost to sustain revenue
More returning buyers increased lifetime value
The business is no longer dependent on constant push. It has a system. Around 14.5% customers are coming back organically. Campaigns are now adding on top of that, not carrying everything.
09 · Expert Analysis
"Most eCommerce brands spend more to grow, while 90% of revenue already lies with existing customers."
Now look at what changed here. The Appco Software strategy did not focus on one thing. It worked on three sides together. Better acquisition, better conversion, and stronger retention. And because all three moved at the same time, results started compounding.
When retention improved, CAC automatically came down. Lower CAC gave more room to scale acquisition. More orders meant better data. And better data improved targeting again. Everything started feeding into each other.
Now one important point. Before this, there was zero discounting. So the brand was only relying on the product. Once small, targeted discounts were introduced, inactive users started coming back. And the cost to do that was still controlled.
Then comes fulfillment. Moving from 80.5% to 65.2% order completion showed a clear shift in operations. Better stock handling, better delivery flow, fewer issues. This reduced customer complaints and improved repeat chances.
10 · Key Takeaways
Retention gives the highest ROI. Even moving from 10% to 15% repeat rate can grow revenue faster than expected.
Strategic discounting is not margin loss. Targeted offers bring back inactive customers and increase AOV while pricing remains controlled.
Fulfillment rate is not just an ops number. Every missed order means a lost customer, a lost review, and a lost repeat chance.
Flat line means no activity. Peaks and dips mean campaigns are running, and growth is being managed.
A 134% order increase in the same store shows one thing. CRO and funnel improvements drive growth, not just more traffic.
A higher return value is normal when sales grow. What matters is the return rate. That shows if the product and expectations are aligne
11 . FUTURE GROWTH PLAN
Launch tiered rewards to push returning rate above 20%
Introduce complementary SKUs to increase average order value
Scale to ₹1 crore quarterly net sales with festive season campaign
Share your goals, and we’ll get back to you within 24 hours with the best solution for your business.